

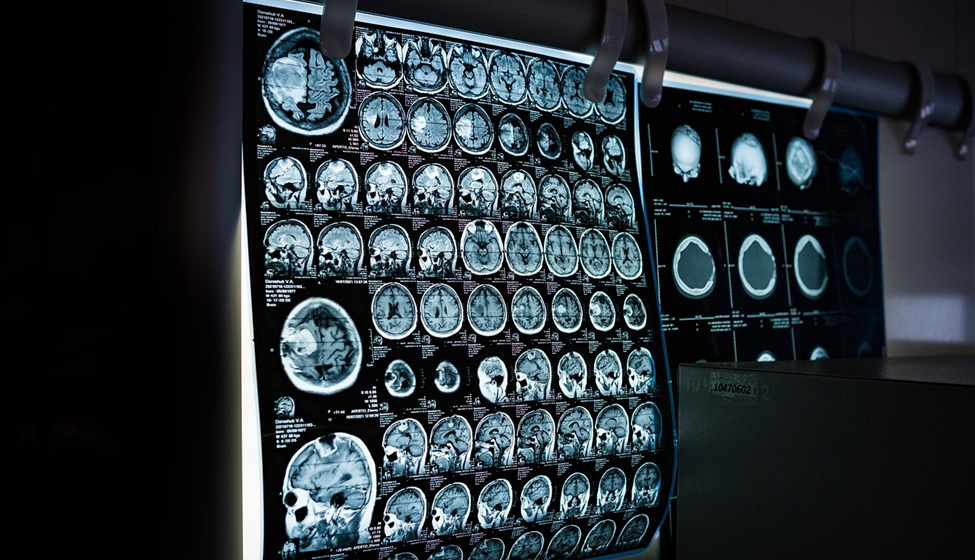
Healthcare professionals now work in an environment where data flows constantly. Electronic health records, wearable devices, diagnostic imaging, and lab results all generate valuable information about patients. In theory, this wealth of data should support better medical decisions. In practice, it can overwhelm clinicians who already operate in high-pressure settings. Sorting through pages of numbers and reports during a busy shift can slow decision-making and increase mental fatigue.
Hospitals across the United States are responding to this challenge by investing in smarter ways to interpret medical data. Visual tools such as dashboards, graphs, and clinical trend charts help teams quickly identify what matters most. Instead of scanning through spreadsheets, physicians and nurses can instantly see patient patterns. These visual systems help staff prioritize care, identify risks earlier, and coordinate treatment across departments.
From Raw Spreadsheets to Actionable Insights in Healthcare
Healthcare organizations collect huge volumes of information every day. Patient histories, medication records, lab results, and imaging reports are all stored in large digital databases. While this information is valuable, raw spreadsheets filled with numbers rarely help clinicians make quick decisions. When data appears as long tables of figures, it takes time to interpret patterns, compare results, or recognize urgent clinical concerns.
Visualization tools help bridge this gap by converting complex datasets into clear visual summaries. Dashboards can highlight abnormal values, show patient trends over time, and display critical indicators in one place. Clinicians no longer need to scan through multiple reports to understand a situation. As healthcare systems rely more heavily on digital records and analytics, professionals who can interpret and present this data effectively are becoming increasingly valuable. Many develop these skills through advanced training programs like a healthcare data analytics master’s online. These programs teach students how to analyze healthcare datasets and design effective visual dashboards. They also focus on translating complex medical information into insights that clinicians can use to guide patient care.
The Psychology of Visual Processing in High-Stress Medical Environments
Medical environments often require fast thinking under pressure. Emergency departments, intensive care units, and surgical teams all operate in situations where seconds matter. In these conditions, the brain processes visual information much faster than written text or numerical tables. Charts, graphs, and color-coded indicators help clinicians understand patient status quickly without slowing down their workflow.
Visual design also reduces mental strain during complex decision-making. When patient information appears in a clear visual format, clinicians can focus on treatment rather than data interpretation. Simple visual signals, such as rising trend lines or highlighted risk indicators, allow teams to recognize problems immediately. s
Real-Time Monitoring: How Dashboards Help Prevent Alarm Fatigue
Modern hospitals rely heavily on monitoring systems that track patient vitals around the clock. These systems generate frequent alerts for heart rate changes, oxygen levels, medication schedules, and other critical indicators. When alarms trigger too often, clinicians can become desensitized. This phenomenon, known as alarm fatigue, makes it harder to recognize truly urgent situations.
Centralized dashboards help address this challenge by organizing patient data into a clear visual overview. Instead of responding to isolated alarms, clinicians can view trends and patterns across multiple indicators. A well-designed dashboard highlights the most critical changes while filtering out less important alerts.
Identifying Population Health Trends and Disease Outbreaks
Data visualization not only supports but also informs decisions at the bedside. It also helps healthcare leaders understand patterns across entire communities. Public health teams analyze aggregated datasets from hospitals, clinics, and laboratories to monitor disease activity. When this information is presented in clear visual formats, such as geographic maps or trend charts, it becomes easier to recognize unusual patterns.
Visual dashboards allow epidemiologists and healthcare administrators to detect early warning signs of outbreaks. Rising case numbers in a specific region can appear quickly through heat maps or timeline graphs. When trends become visible early, healthcare systems can respond faster and limit the spread of illness.
Reducing Diagnostic Errors Through Clear Trend Analysis
Diagnosing medical conditions often requires identifying subtle patterns across multiple data points. Clinicians review lab results, vital signs, imaging reports, and patient histories to determine what may be happening. When this information sits in separate reports or long data tables, important clues can be overlooked.
Visualization tools organize this information into timelines and trend charts that show how patient indicators change over time. A steady increase in inflammation markers or a gradual drop in oxygen levels becomes easier to recognize when displayed visually. These clear patterns help clinicians catch developing problems earlier and adjust treatment plans before conditions worsen.
Improving Patient Communication with Visual Health Data
Patients often struggle to understand medical numbers or technical terminology. Blood pressure readings, cholesterol levels, and glucose measurements can feel abstract when presented as isolated values. Visual health charts make this information easier to interpret and discuss during appointments.
When clinicians show patients graphs that track their progress over time, the conversation becomes clearer and more collaborative. Patients can see how lifestyle changes or medications affect their health metrics. Clear communication builds trust and encourages patients to take an active role in managing their health.
The Future of AI-Driven Predictive Visualization in Medicine
Healthcare technology continues to evolve, and visualization tools are becoming more advanced. Artificial intelligence now helps analyze large medical datasets and identify patterns that may not be obvious to human observers. These systems can present predictions through visual dashboards that estimate potential risks or treatment outcomes.
In fields such as oncology and surgery, predictive visualization can support more personalized treatment decisions. Clinicians may review probability charts that estimate a patient’s likelihood of responding to different therapies. As these systems improve, visual analytics will help healthcare teams combine clinical judgment with advanced data insights to guide complex care decisions.
The Growing Importance of Data Visualization in Healthcare
Healthcare organizations generate enormous amounts of patient data every day. Without a clear interpretation, that information can overwhelm clinicians and slow important decisions. Data visualization transforms complex datasets into understandable insights that medical teams can act on quickly.
Visual dashboards support faster clinical decisions, reduce diagnostic errors, and improve communication with patients. They also help public health teams monitor disease trends and prepare for emerging risks. As healthcare becomes more data-driven, the ability to translate numbers into clear visuals will remain essential for improving outcomes and supporting better care across the entire system.
